Streamlining Log Monitoring: Building a Dashboard with Grafana, Loki, and Promtail


Introduction:
In today's fast-paced digital landscape, effective log monitoring is essential for ensuring the reliability, security, and performance of software applications and infrastructure. Traditionally, managing logs across distributed systems can be challenging, requiring complex configurations and infrastructure. However, with the advent of modern logging solutions like Grafana, Loki, and Promtail, organizations can streamline log collection, aggregation, and visualization.
What is Grafana, Loki, and Promtail?
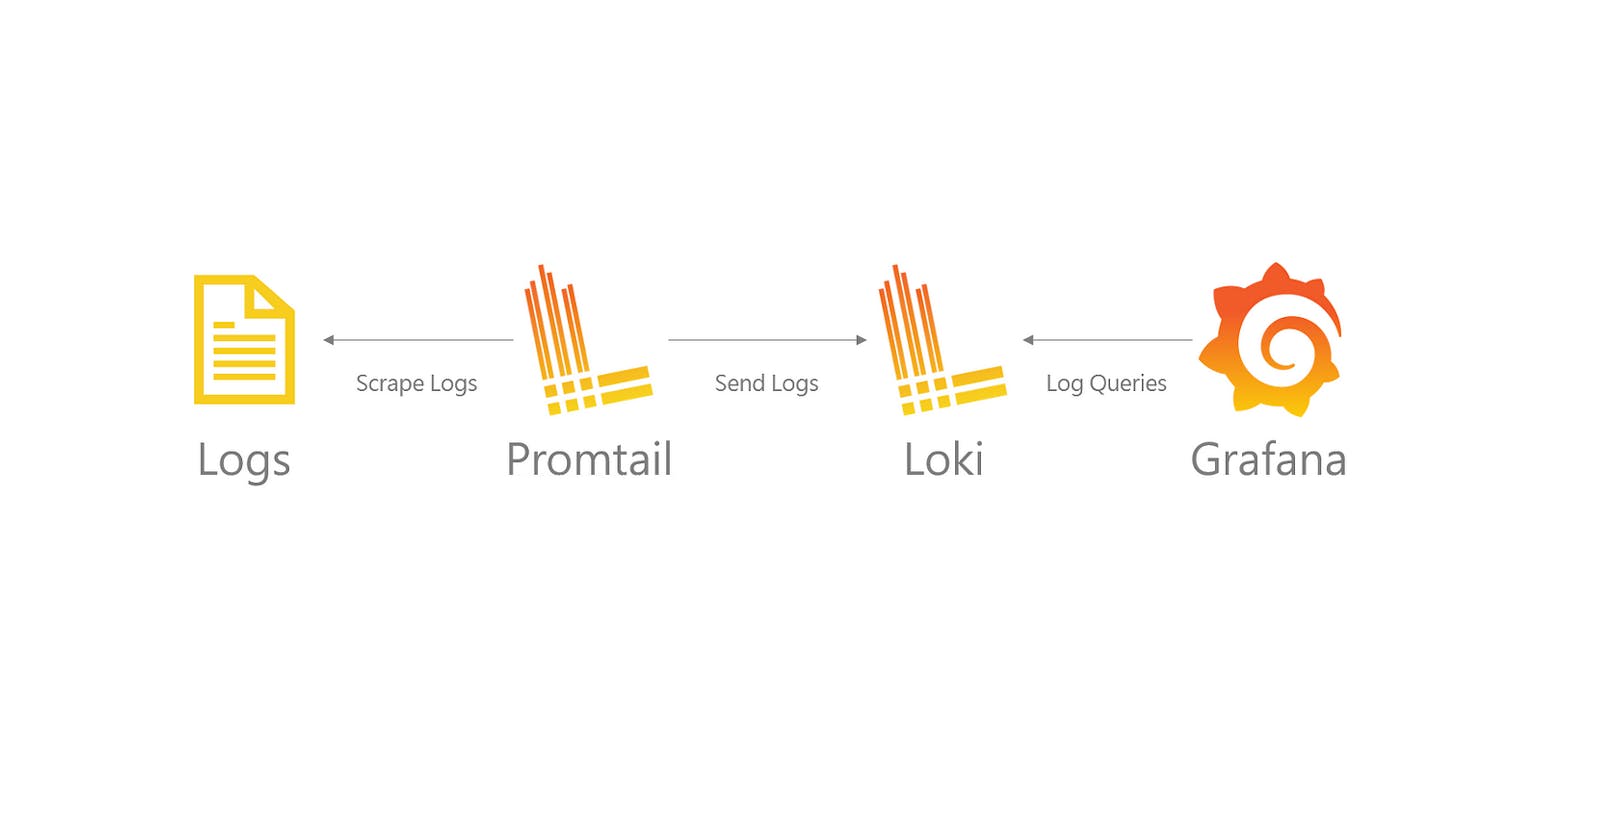
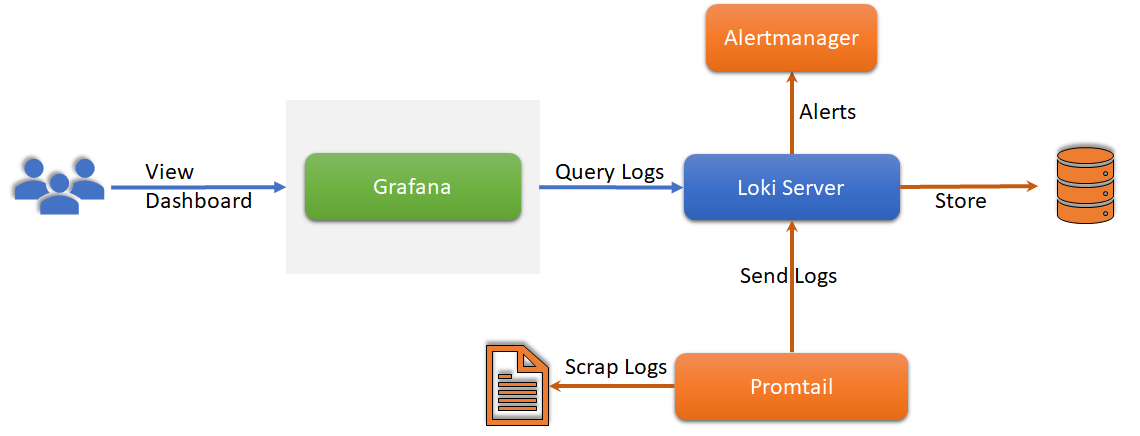
Grafana is a leading open-source platform for monitoring and observability, renowned for its intuitive dashboarding capabilities and extensive integrations. It allows users to create visually stunning dashboards to monitor various metrics and logs.
Loki, on the other hand, is a horizontally scalable, highly efficient logging backend built for cloud-native environments. It is designed to handle large volumes of log data while maintaining a small storage footprint.
Promtail serves as the agent responsible for collecting logs and forwarding them to Loki. It seamlessly integrates with various logging frameworks and is highly configurable.
Why Integrate Grafana with Loki and Promtail?
Integrating Grafana with Loki and Promtail offers several advantages:
Centralized Logging:
Cost-Effective:
Real-Time Monitoring:
Salability:
Creating a Dashboard with Grafana, Loki, & Promtail
Prerequisites
1) Install and configure Grafana in an EC2 instance. Follow my previous blog - https://kshitijaa.hashnode.dev/grafana-setup
2) Install Docker on Grafana instance
sudo apt update -y
sudo apt install docker.io -y
sudo chown $USER /var/run/docker.sock
docker ps
sudo systemctl enable --now docker
#sudo usermod -aG docker $USER && newgrp docker
sudo systemctl restart docker
sudo systemctl status docker
3) Make sure your Grafana Server is started and running
sudo systemctl status grafana-server
Let's start with the setup
1) Create Folder named grafana-configs/ on your home directory
mkdir grafana-configs/
cd grafana-configs
2) Setup Loki Server
Download the yaml file that will contain the required configuration for running loki.
wget https://raw.githubusercontent.com/grafana/loki/v2.8.0/cmd/loki/loki-local-config.yaml -O loki-config.yaml
cat loki-config.yaml
Get into Loki port : 3100; push to Loki port 9096
Run Loki Server through Docker container -
We are using Docker to make a communication between loki server and Promtail server through networking
docker run -d --name loki -v $(pwd):/mnt/config -p 3100:3100 grafana/loki:2.8.0 --config.file=/mnt/config/loki-config.yaml
Edit the inbound rules of the Grafana Instance

http://<EC2-instance-IP-address>:3100

Your Loki is up and running!
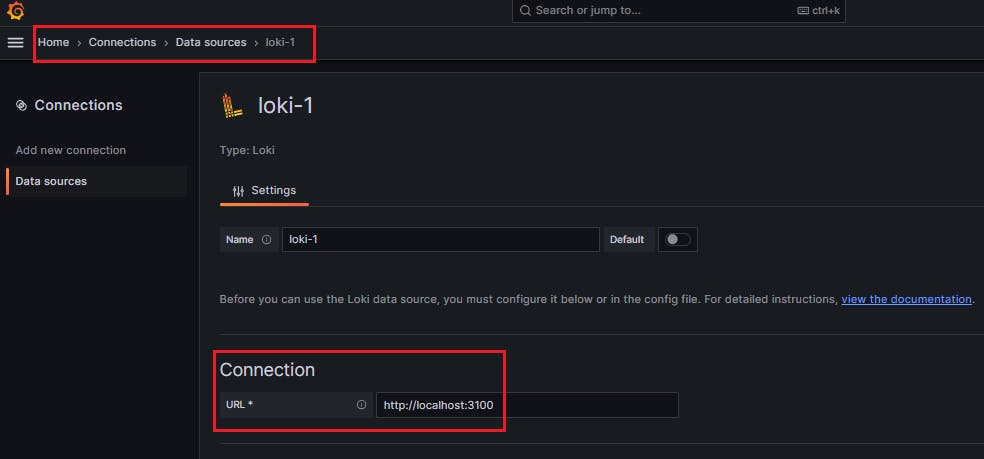
3) Add Loki as Data Source in Grafana
Login to Grafana Dashboard; Click on Add your data source

Go to 'Logging & document databases' and select Loki

To make a connection write URL localhost:3100
Click on Save & test. if you see below the data source successfully connected.
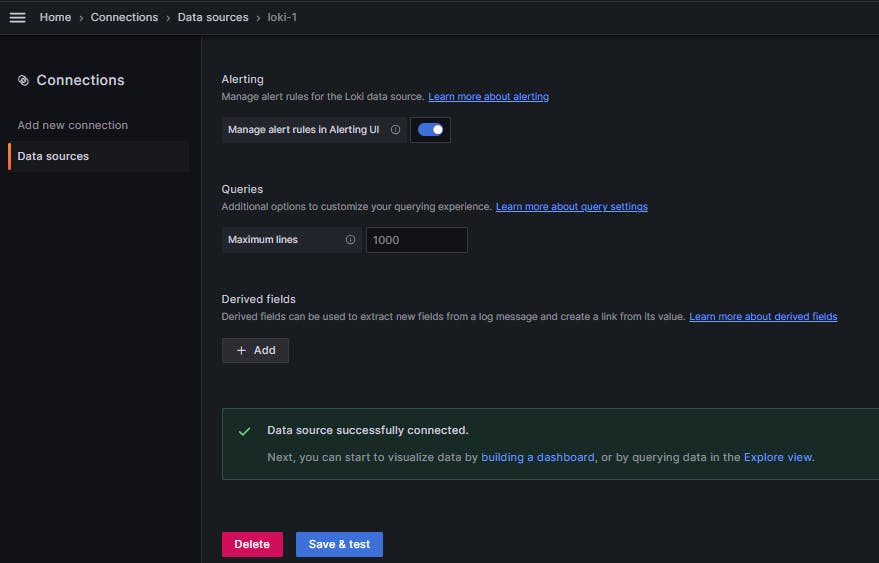
Data source successfully connected!
4) Download Promtail Config
This setup is to collect logs from your definedpath and sent it to Loki server
wget https://raw.githubusercontent.com/grafana/loki/v2.8.0/clients/cmd/promtail/promtail-docker-config.yaml -O promtail-config.yaml
*Promtail Port 9080 ; Get Data in the Promtail through path /var/log/log
Promtail Push its data to Loki at loki:3100/loki/api/v1/push
5) Run Promtail Docker container
docker run -d --name promtail -v $(pwd):/mnt/config -v /var/log:/var/log --link loki grafana/promtail:2.8.0 --config.file=/mnt/config/promtail-config.yaml

Both the Loki and Promtail are up and running now!
6) Setup a dashboard in Grafana
Click on Dashboard -> Add visualization

Select Data source -> loki , label filters --> job --> = --> varlogs and Run query

Select your data visualization preference to 'Switch to table'

And the dashboard is visible like below.

Now, Click on the operations -> Range function -> Rate as a visualization option to view in a graphical manner

After selecting Run query

Dashboard is available with the below details shows aggregate sum of words repeating This can be achieved by setting the varlogs as label filters.

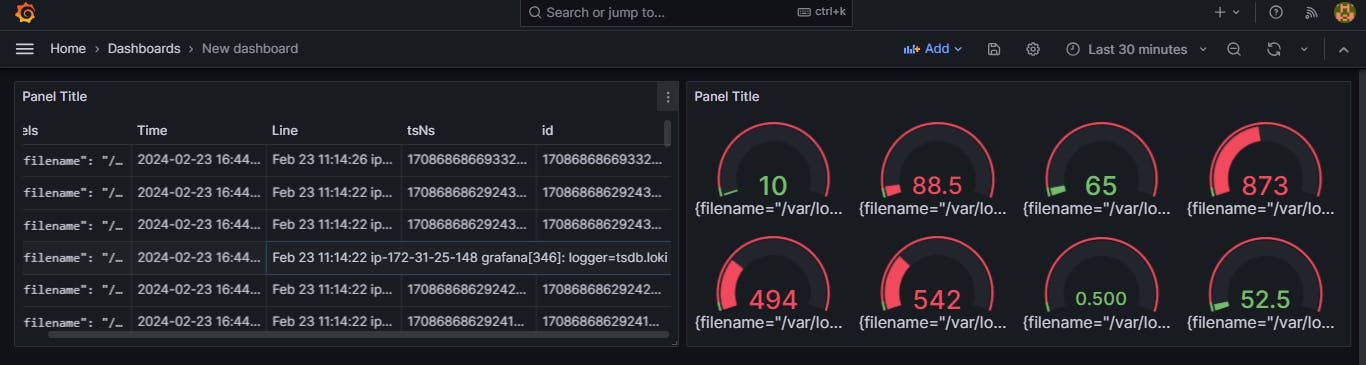
We can see now the complete grafana dashboard.
Conclusion
Effective log monitoring is essential for maintaining the health, performance, and security of modern applications and systems. By leveraging tools like Grafana, Loki, and Promtail, organizations can streamline log monitoring processes, gain valuable insights, and respond proactively to issues. Building a comprehensive log monitoring dashboard enables teams to visualize, analyze, and act upon log data efficiently, ensuring optimal system performance and reliability. Embrace these powerful tools to take your log monitoring capabilities to the next level and stay ahead in today's dynamic technological landscape.
Make sure to stop the EC2 Instance if it is not in use! 😊
Thanks for spending your valuable time in learning to enhance your career!😃🙏
Follow me on
Hashnode: kshitijaa.hashnode.dev
LinkedIn: https://www.linkedin.com/in/kshitija-bartakke-malwade-39678b141/