Grafana Setup
Setup grafana in your local environment on AWS EC2.
https://grafana.com/docs/grafana/latest/setup-grafana/installation/debian/
Hope you are now clear with the basics of grafana, like why we use, where we use, what can we do with this and so on. https://kshitijaa.hashnode.dev/introduction-to-grafana
Now, let's do some practical stuff. I am very excited! 😀
Login to the AWS console and Launch an EC2 instance
EC2 Instance Name - Grafana | AMI - Ubuntu | Instance Type - t2.micro | Security group - Default
Instance is launched and here are some basic details

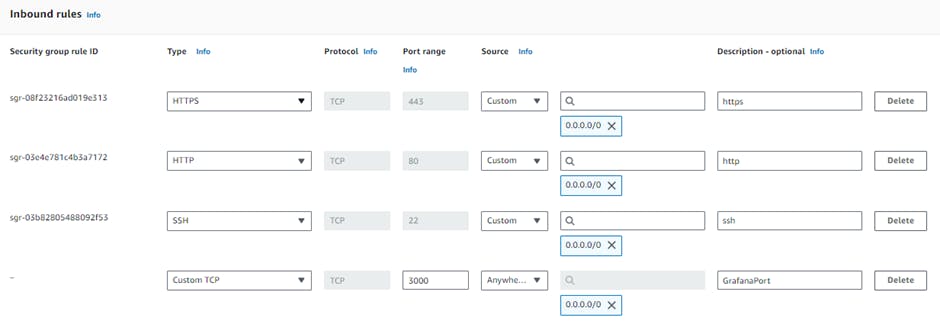
Open port 3000 in your EC2 instance's security group to allow external access to Grafana.

Login to EC2 Instance using 'EC2 Instance Connect' and follow below steps to install grafana
1) First make sure your system is up to date, has all updated installed before doing anything
sudo apt update -y
2) Install the prerequisite packages:
sudo apt-get install -y apt-transport-https software-properties-common wget
3) Import the GPG key:
sudo mkdir -p /etc/apt/keyrings/

wget -q -O - https://apt.grafana.com/gpg.key | gpg --dearmor | sudo tee /etc/apt/keyrings/grafana.gpg > /dev/null
4) To add a repository for stable releases, run the following command:
echo "deb [signed-by=/etc/apt/keyrings/grafana.gpg] https://apt.grafana.com stable main" | sudo tee -a /etc/apt/sources.list.d/grafana.list
5) To add a repository for beta releases, run the following command:
echo "deb [signed-by=/etc/apt/keyrings/grafana.gpg] https://apt.grafana.com beta main" | sudo tee -a /etc/apt/sources.list.d/grafana.list
6) Run the following command to update the list of available packages:
sudo apt-get update -y
7) To install Grafana OSS, run the following command:
sudo apt-get install grafana
8) Start Grafana Server
sudo systemctl daemon-reload
sudo systemctl start grafana-server
sudo systemctl status grafana-server

9) To verify that the service is running.
sudo systemctl status grafana-server
10) Configure the Grafana server to start at boot using systemd
sudo systemctl enable grafana-server.service
Access Grafana 💃
Finally, you can access the Grafana web interface by navigating to the IP address or domain name of your EC2 instance in your web browser, followed by the default Grafana port 3000.
For example: http://<EC2-instance-IP-address>:3000

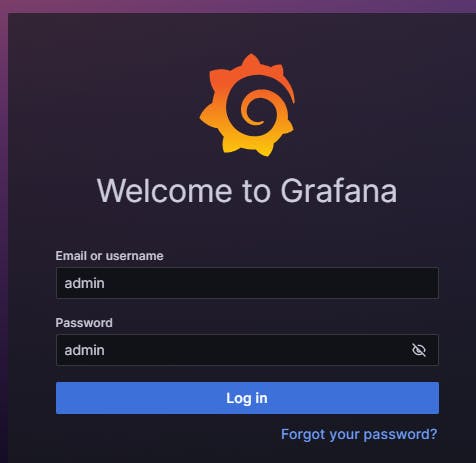
You should now be able to log in to Grafana using the default credentials (admin/admin) and start creating your first dashboards.

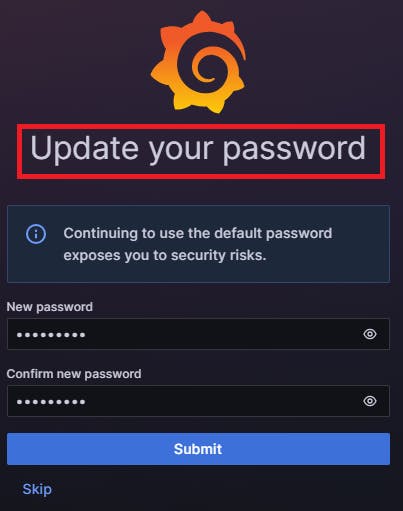
Now, as this default password is risky to keep, It is now prompting to update with the new password. YOU SHOULD DEFINATELY DO THIS WITHOUT SKIPPING.
A responsible DevOps Engineer will always make sure that their data is safe and highly protected!


Here is where actual fun started!
Stay tuned for upcoming setup!
Thanks for spending your valuable time in learning to enhance your career!😃🙏
Follow me on
Hashnode: kshitijaa.hashnode.dev
LinkedIn: linkedin.com/in/kshitija-bartakke-malwade-3..
